

Find and open a monitored deal
Open Portfolio, filter the table and select a deal. Check the borrower, monitoring status and available deal terms. Use the record identifier when matching a console record to your servicing system.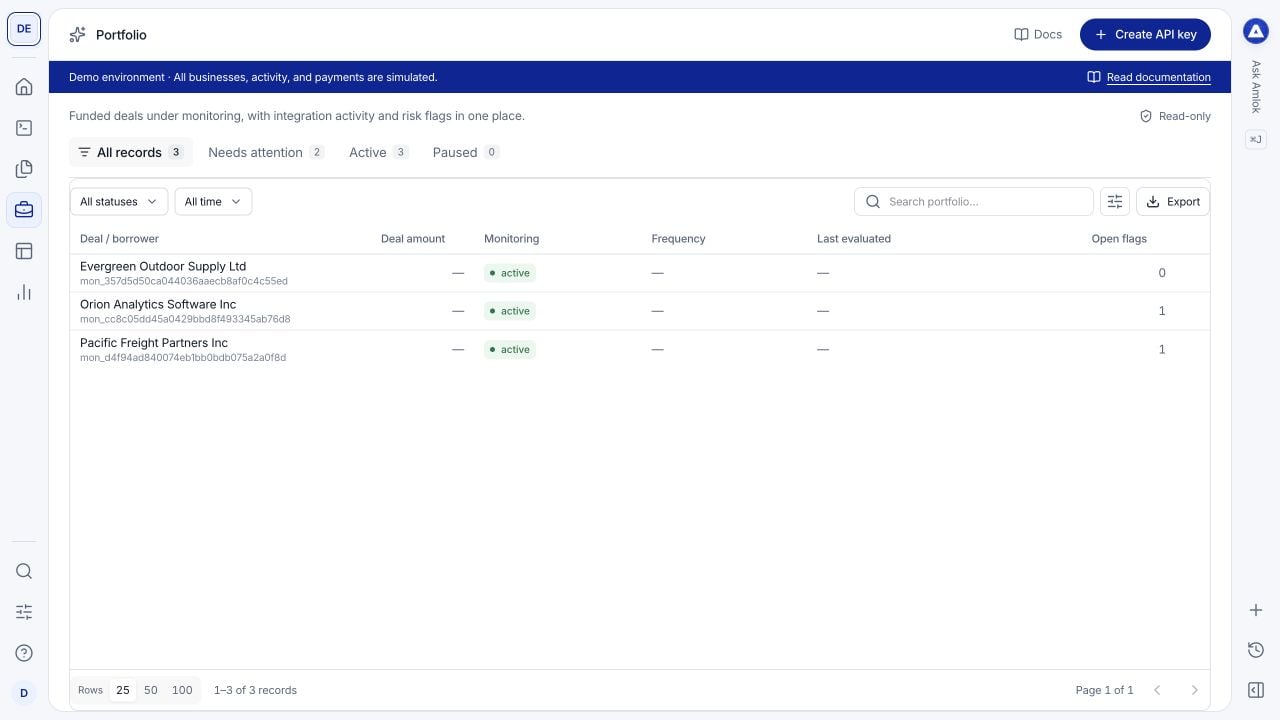
The portfolio table gives you a starting point for reviewing active monitoring records. These businesses are fictional.
The count on a tab represents associated records. It is not a coverage score. Missing values or an empty list should not be interpreted as a healthy result.
Overview
Start here to establish the context before investigating a change. The summary shows the borrower, Signal product, deal amount and monitoring frequency when available. Scroll through the drawer for:- Linked origination: the original underwriting record, when linked. Follow it to compare with the original risk package and application evidence. No linked origination means the relationship is absent, not that underwriting failed.
- Deal dimensions & terms: recorded financing details and terms. Expand nested values such as funded or outstanding amounts when provided.
- Borrower information: the subject being monitored and its recorded attributes.
- Monitoring overview: the last evaluation, integration count, recorded syncs and open flags.
- Monitoring baselines: associated baseline records. Open a row to inspect the available baseline information. Activity appears when activity is recorded.
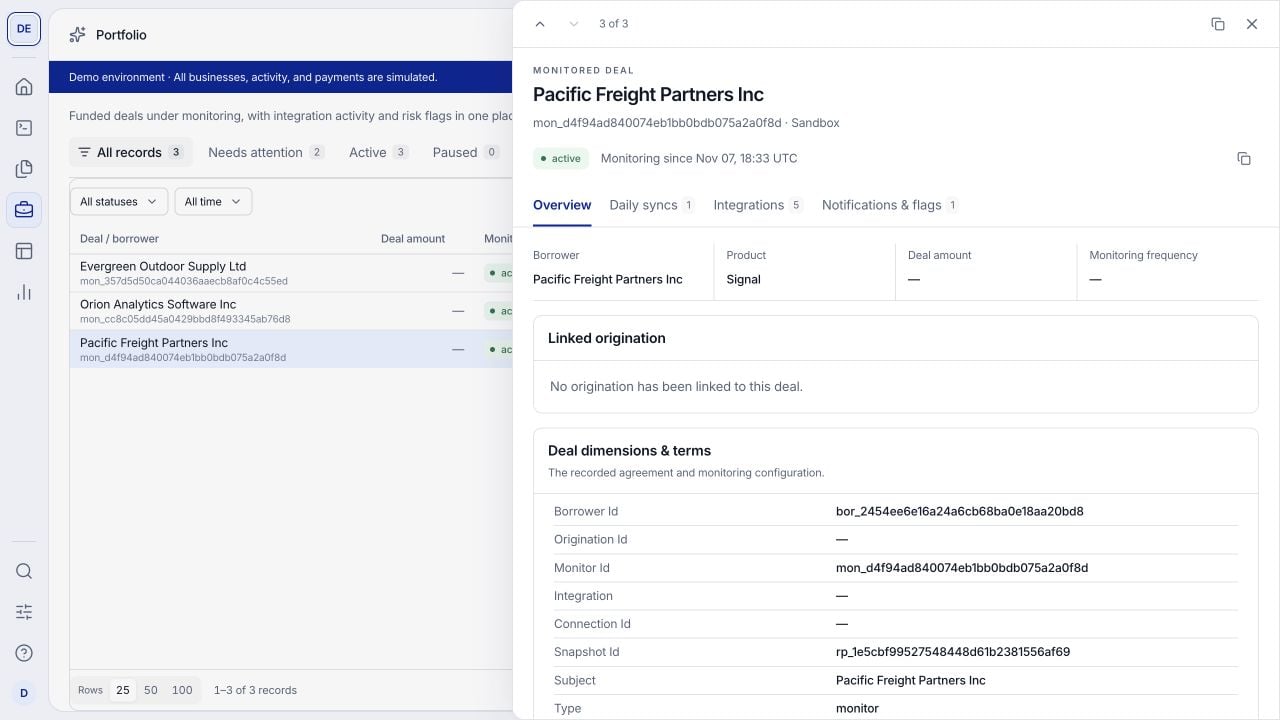
Overview establishes the deal and borrower context before you investigate a sync or flag. Scroll down to review monitoring and baseline information.
Daily syncs
Use Daily syncs to inspect recorded refresh activity associated with this monitored deal. The table shows Time (UTC), Sync, Integration and Status. Filter or search the records, then select a row for its details, available summary and outcome.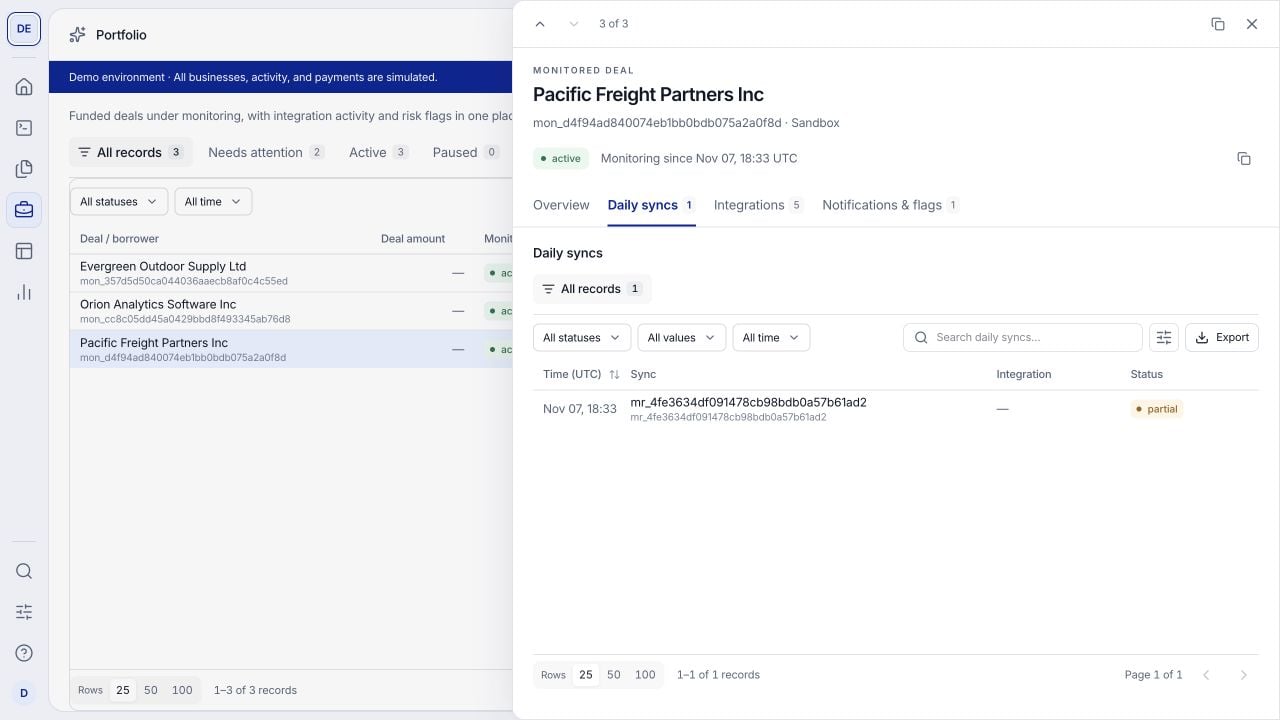
Daily syncs exposes recorded refresh outcomes. This example contains a partial result that deserves further inspection.
Integrations
Use this tab to review the borrower connections linked to the monitored deal. The table shows Integration, Provider, Status, Frequency and Last sync, where recorded. Select a row to inspect its details and available source information.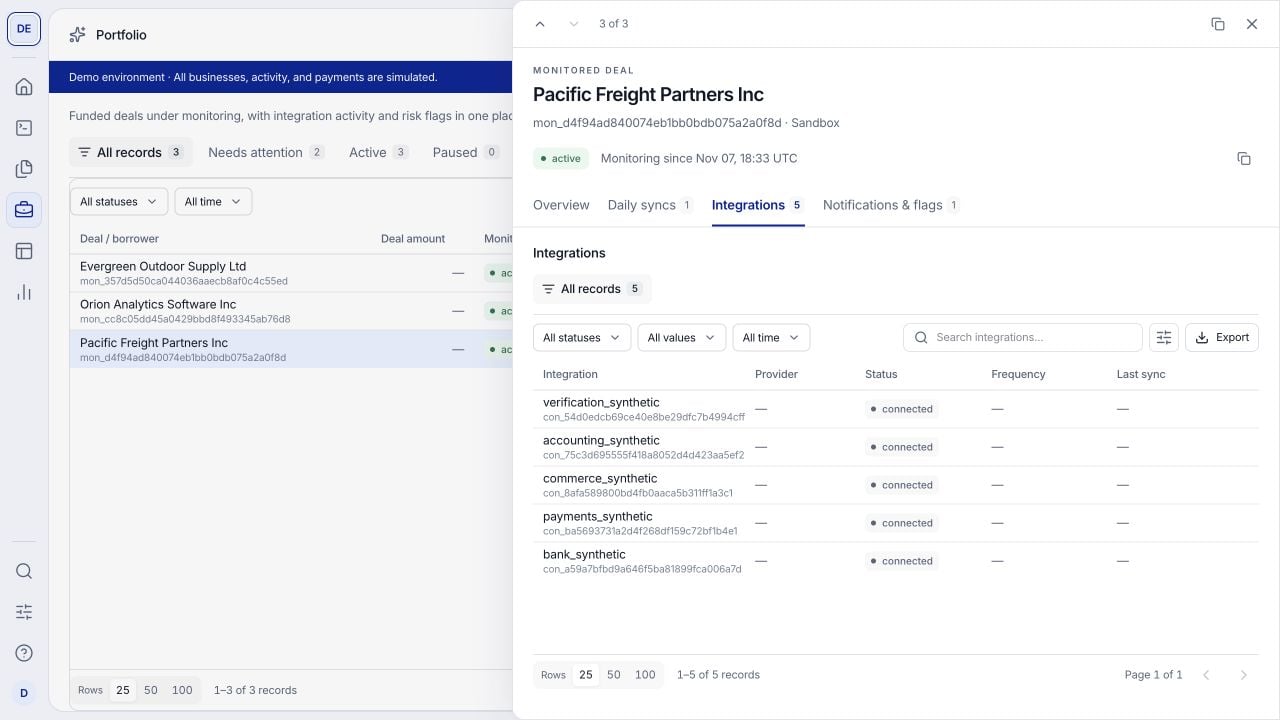
These five synthetic connections belong to the selected monitored deal. Source status and data freshness answer different questions.
Notifications and flags
Open Notifications & flags to review detected changes associated with the monitored deal. The table shows Time (UTC), Flag, Severity and Status. Start with the event’s reason and current state, then examine the supporting context.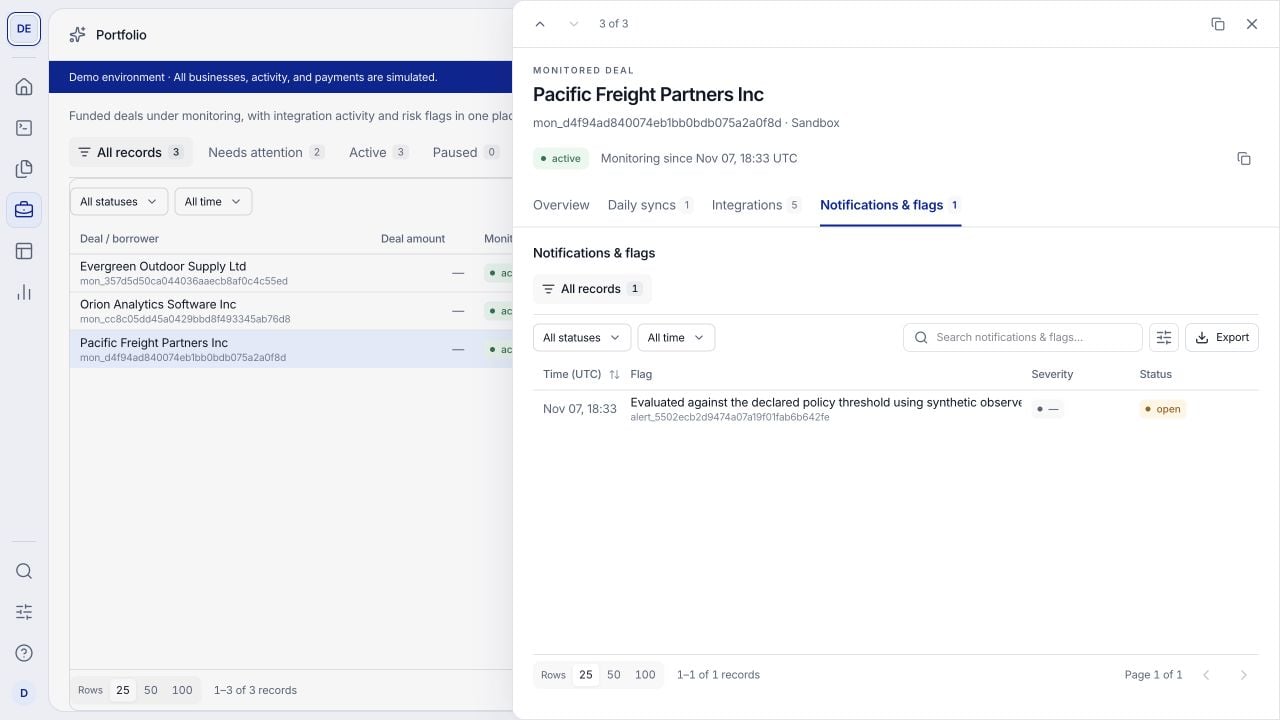
Notifications and flags stay attached to the monitored deal they describe. Open a flag to inspect its explanation and associated deliveries.
1
Read the flag
Select its row. Review the readable fields and summary, including available measurements and evidence references. Compare the change with the baseline and previous observations where supplied. Severity indicates the reported importance; status describes the flag’s current state.
2
Inspect the event payload when needed
Owners and Developers can inspect Webhook event JSON and download the captured event. Use its identifiers to correlate it with your own system. The readable summary and technical payload describe the same event from different perspectives.
3
Check the delivery history
Review Webhook deliveries in the flag details. Open a delivery to inspect recorded attempts, response status, latency and result. A generated flag does not prove your endpoint received it. Multiple delivery attempts can belong to one event; they are not necessarily separate risk changes.